CONDOR - A multi-static meteor radar system in northern Chile
Supported by the U.S. National Science Foundation.
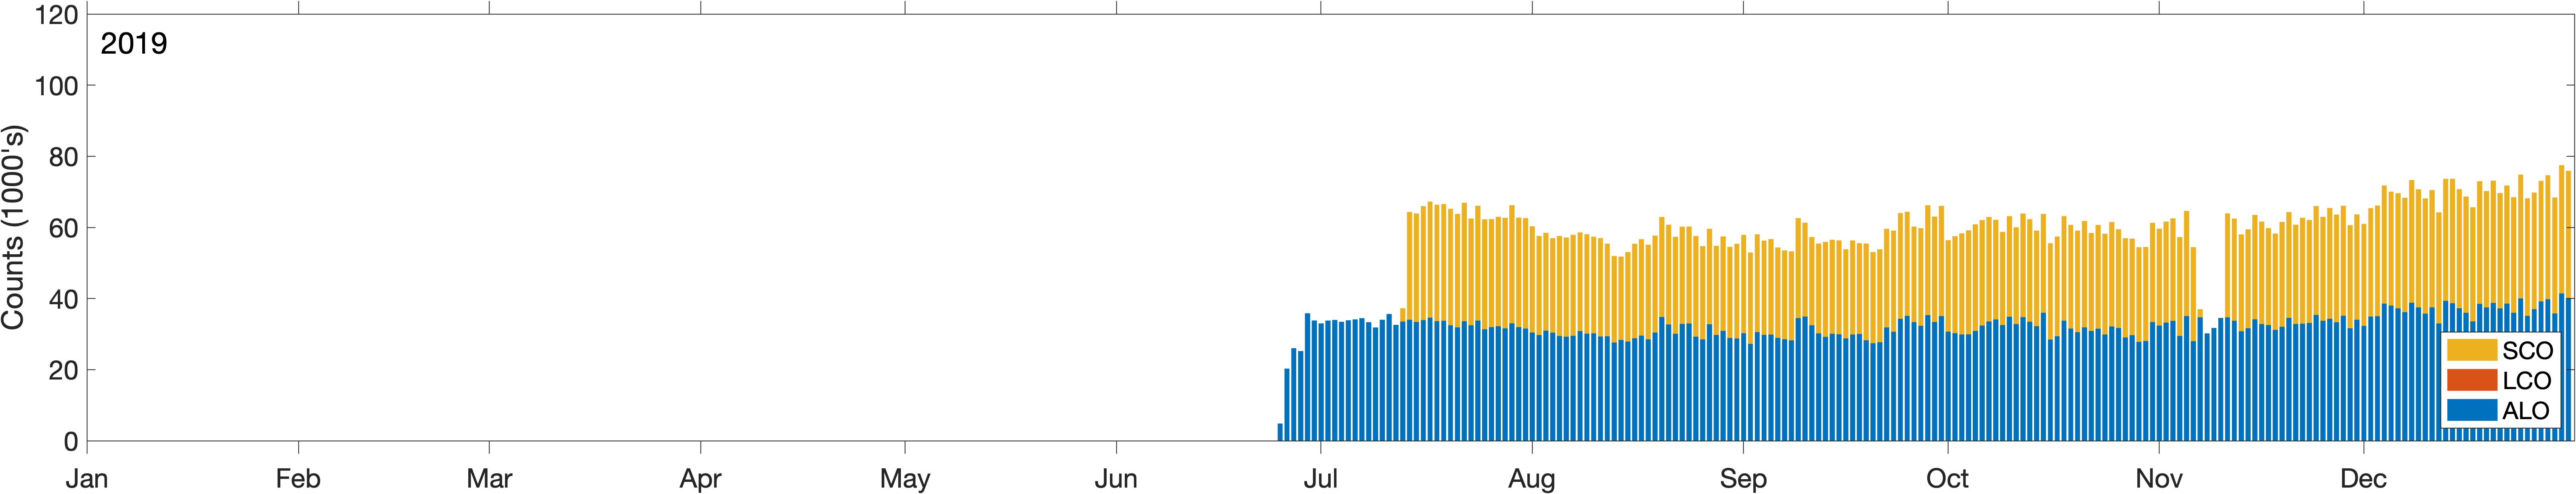
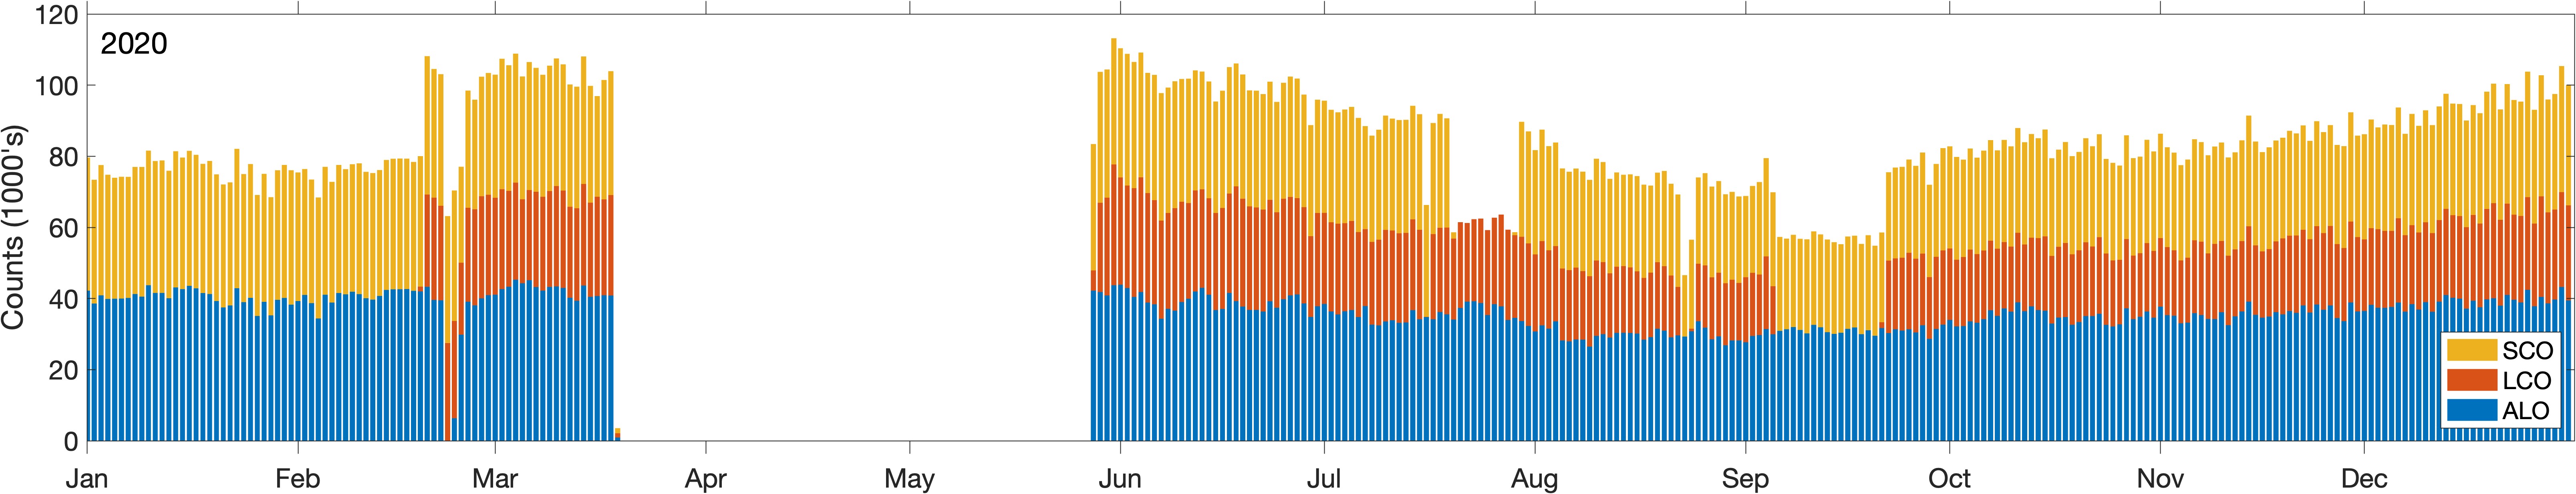
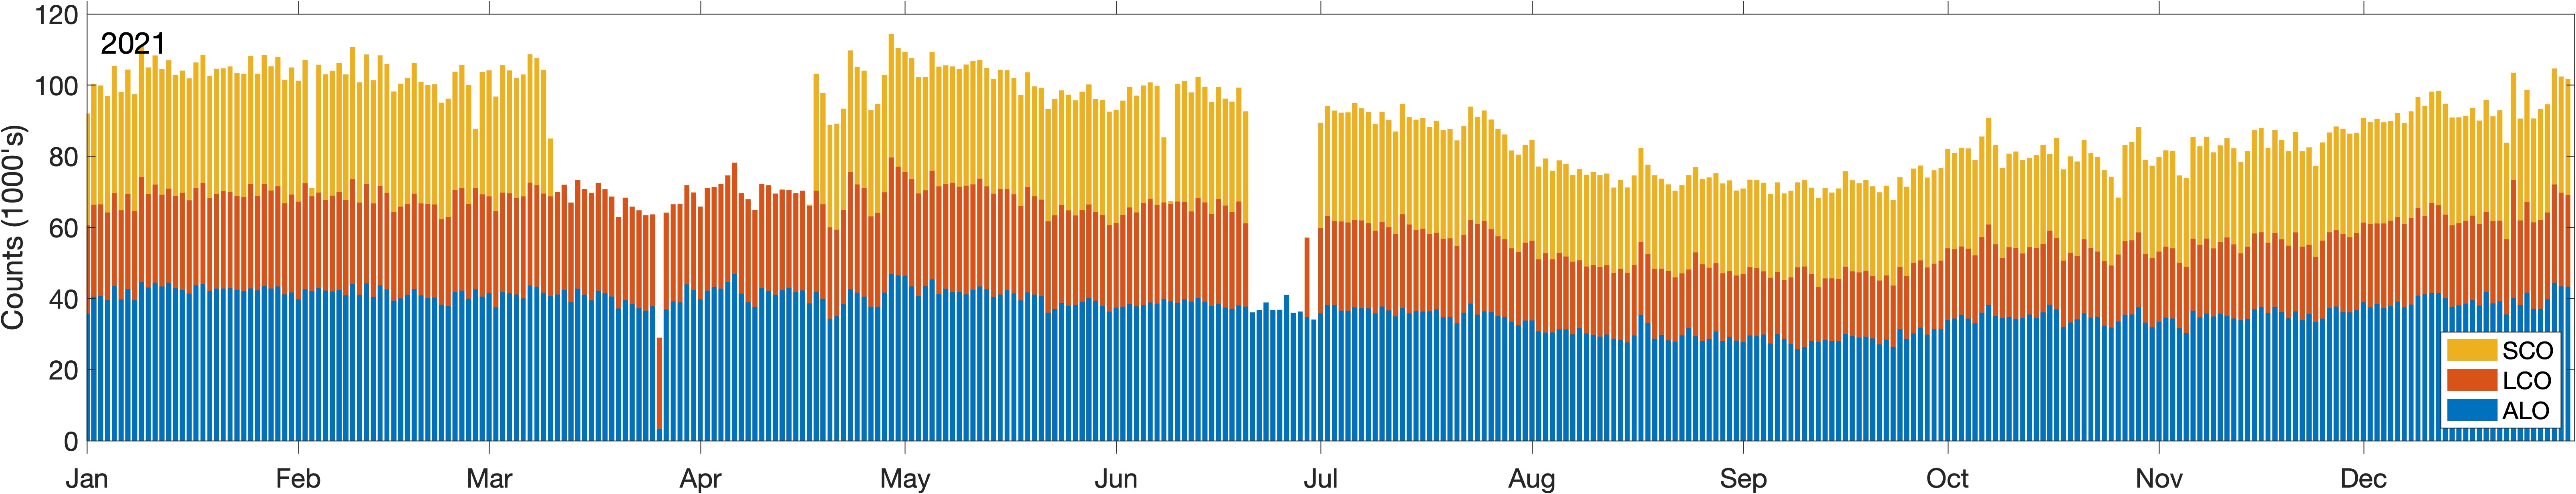
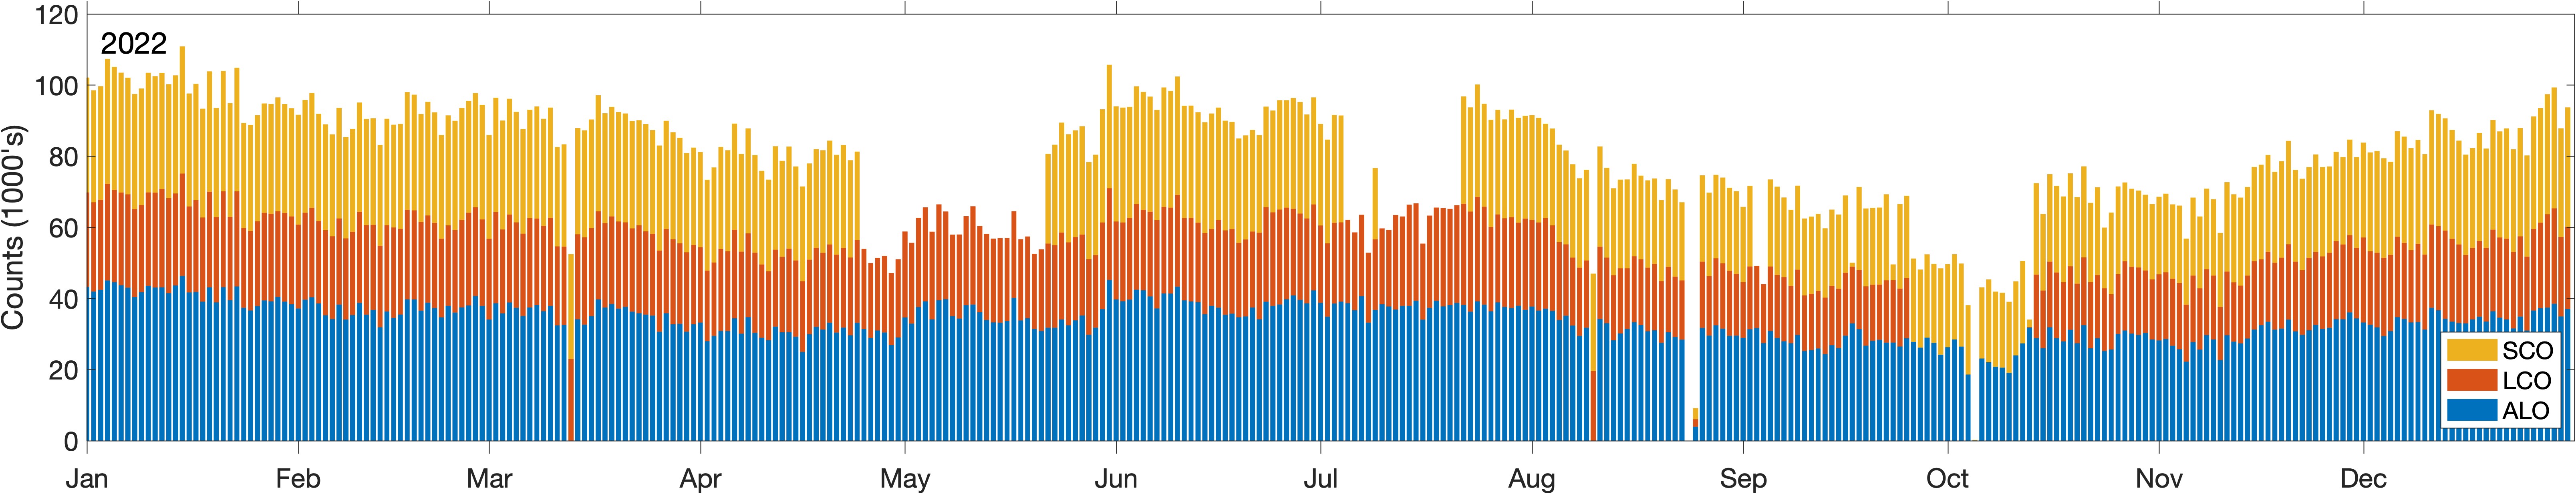
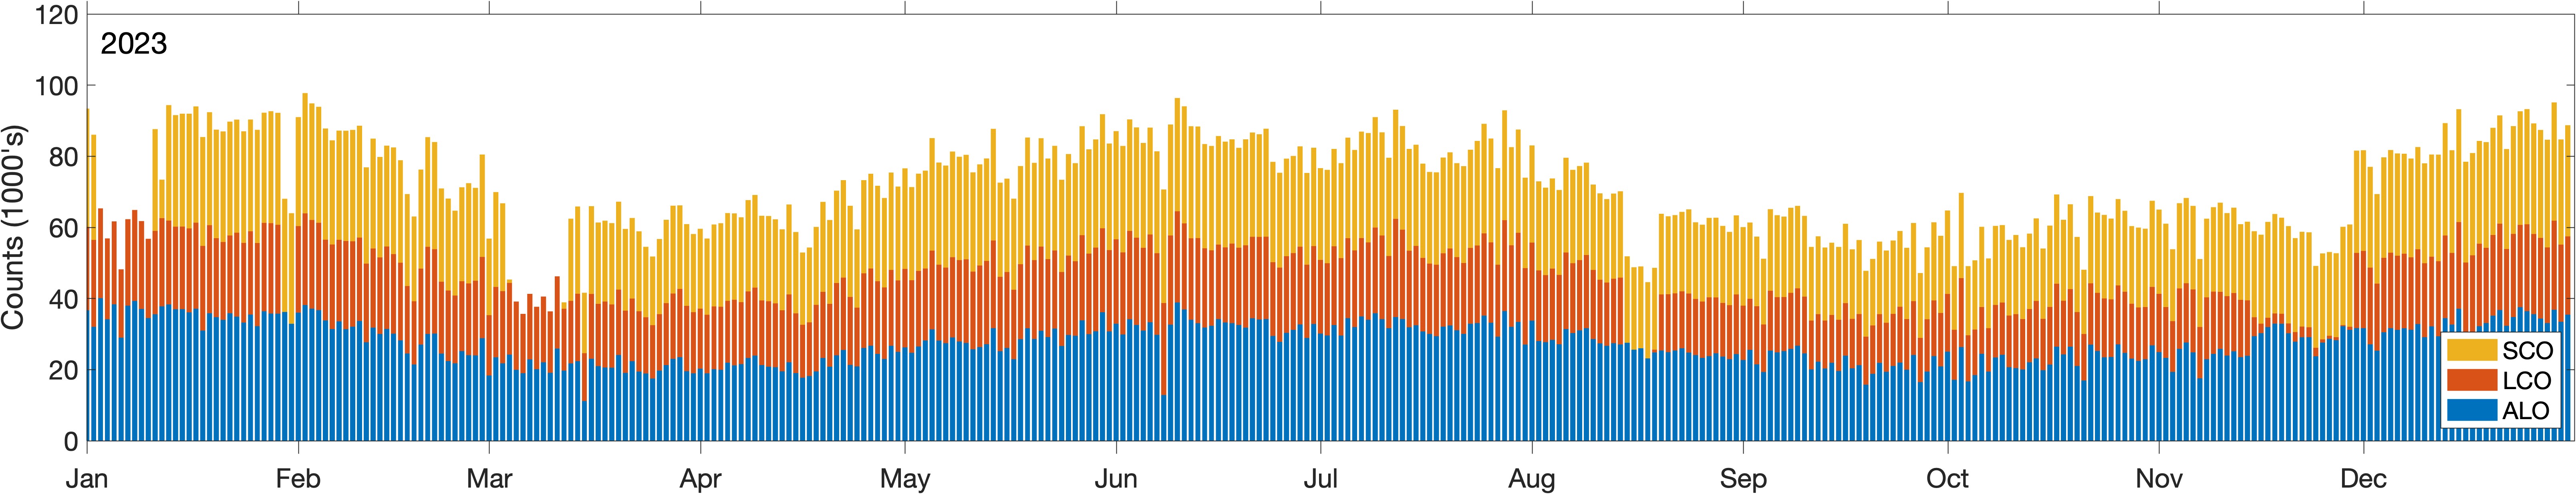
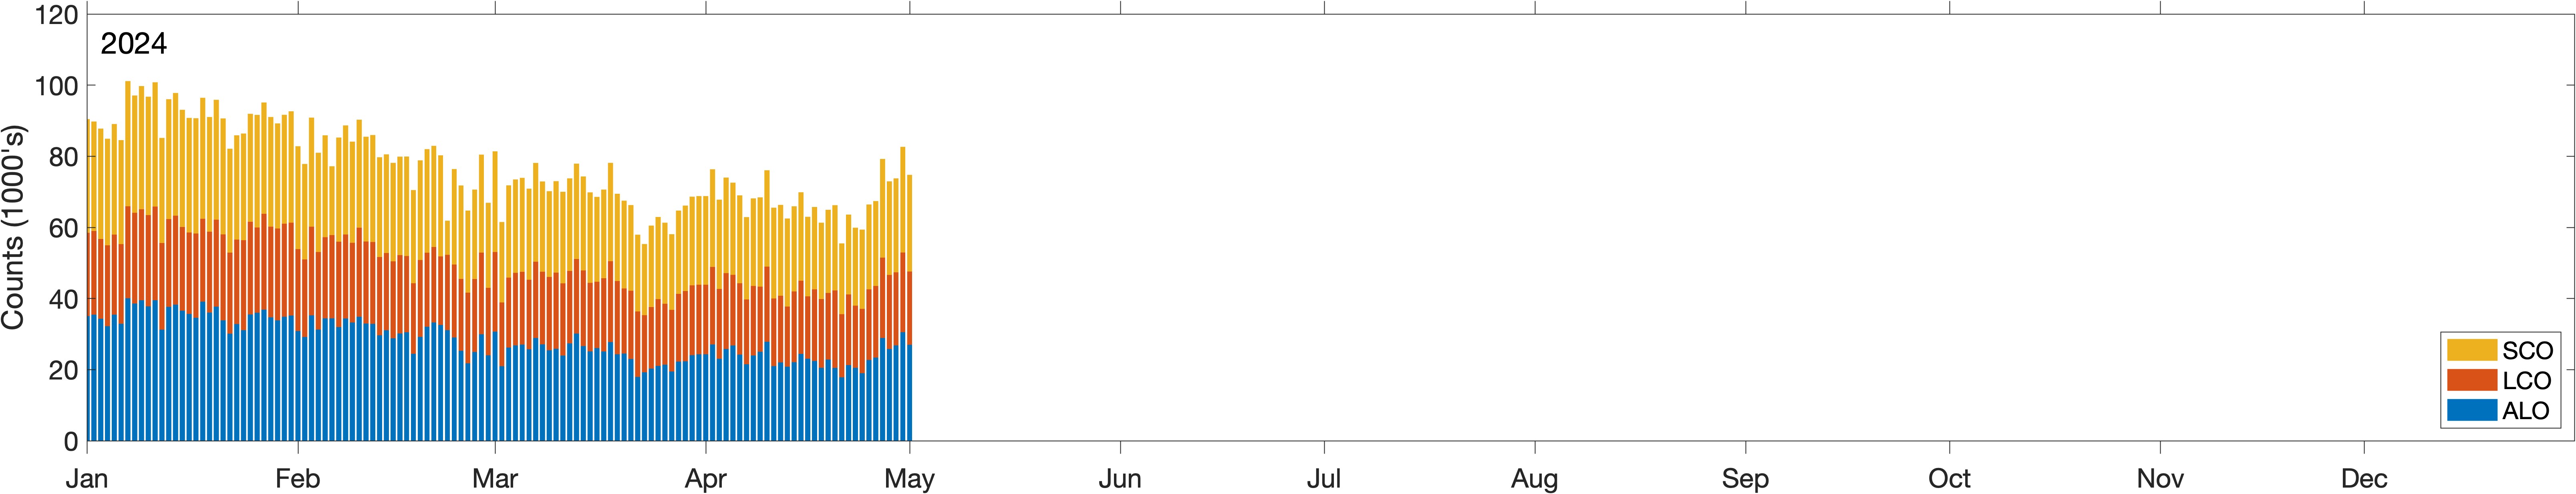
Daily valid counts from all three sites are shown in the stacked bar charts below. Click to see a larger image.
Click the year on the left to view contour plots of monthly horizontal wind measured by the radar system.
More details of this radar system are described here.